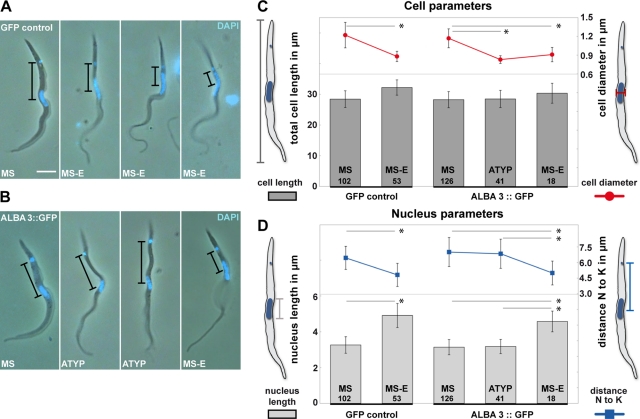
FIGURE 6:
Characterization of the transition from mesocyclic trypomastigote to epimastigote stage in the GFP control and the ALBA3::GFP–expressing strain. Still images extracted from movies of cells of the AnTat1.1 strain expressing GFP control (A) or the ALBA3::GFP (B) after fly dissection. Phase images were superimposed with the fluorescent DAPI signal in blue. Black bars indicate the distance between the nucleus and the kinetoplast. Scale bar, 5 μm. Cellular (C) and nuclear parameters (D) in mesocyclic (MS), parasites in transition from mesocyclic trypomastigote to epimastigote (MS-E), and atypical forms (ATYP, found in ALBA3::GFP infected flies only). Numbers of analyzed parasites are indicated in the bars. (C) Left axis, total cell length plotted as dark gray bars (μm ± SD); right axis, cell diameter shown as red curve (μm ± SD). (D) Left axis, nucleus length plotted as light gray bars (μm ± SD); right axis, distance between the nucleus and the kinetoplast centers shown as blue curve (μm ± SD). Analysis of variance tests were performed, and significant comparisons by Tukey ad hoc posttests are indicated on the histogram with *p < 0.0001.

