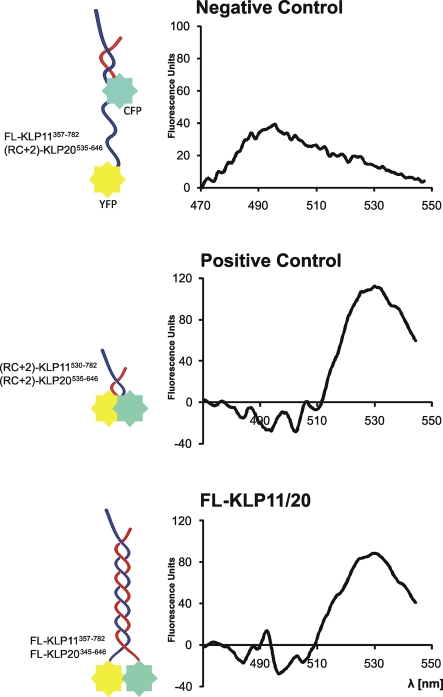
FIGURE 5:
FRET analysis confirms the close proximity of the motor heads in wild-type kinesin-2. Curves represent net FRET signal obtained after subtracting signals obtained with only one fluorophore (YFP or CFP) in the CFP channel (which is also the FRET channel) from the signal obtained with the FRET pair (KLP11-YFP/KLP20-CFP) in the CFP channel. When excited with 435 nm CFP transfers energy to YFP (excitation wavelength 505 nm), which then emits with a maximum at 530 nm. FRET signal is thus visible as a peak at 530 nm. Owing to the large separation of the fluorophores in the negative control (FL-KLP11/(RC+2)-KLP20) the curve represents only the remainder of the CFP emission spectrum and no maximum at 530 nm. Positive control (RC+2)-KLP11/20 and FL-KLP11/20 all display FRET signals at 530 nm. After determining FRET efficiencies, distances between CFP and YFP were calculated to be 4.6 nm in the positive control (RC+2)-KLP11/20 and 4.9 nm in FL-KLP11/20.

