FIGURE 2:
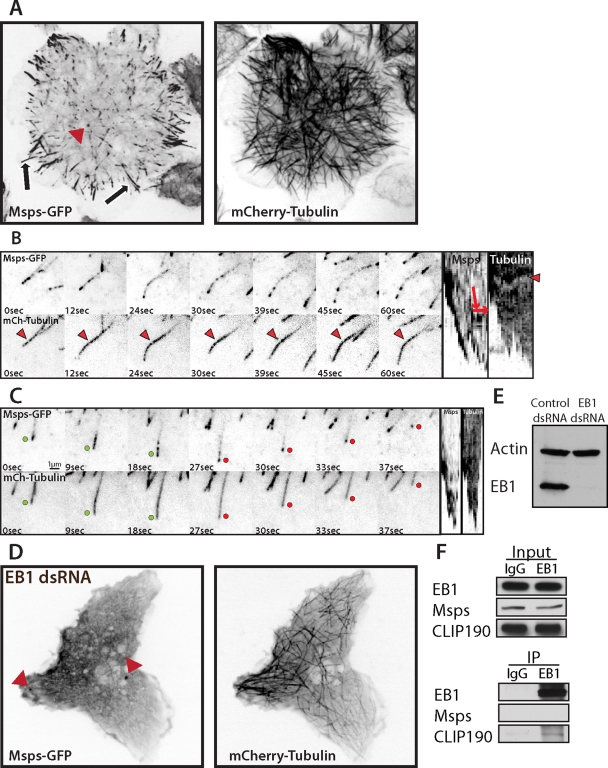
Msps-GFP dynamics in S2 cells is EB1 dependent. (A) (Supplemental Movie S1) Interphase S2 cell expressing mCherry α-tubulin (right) and Msps-GFP (left) on microtubule plus ends in the interior, peripheral lattice accumulations (arrows), and centrioles (red arrowhead). (B) (Supplemental Movie S2) Msps-GFP dynamically moving along peripheral microtubules, represented as a kymograph (right). Red arrows on the kymograph (far right) indicate the direction of movement, and red arrowheads represent a fiduciary fluorescent mark along the microtubule that indicates microtubule translocation (kymograph, right). (C) (Supplemental Movie S3) Times series and kymograph of S2 cells expressing Msps-GFP (top) and mCherry α-tubulin (bottom). Growing ends are indicated by green dots and shrinking ends by red. (D) EB1-depleted S2 cell expressing Msps-GFP (left) and mCherry α-tubulin (right). (E) Western blot demonstrating EB1 knockdown from D over 6 d of RNAi. (F) Immunoprecipitation of EB1 and Western blot for EB1 (right, top), Msps (right, middle), and EB1-binding protein CLIP190 (right, bottom).

