FIGURE 4:
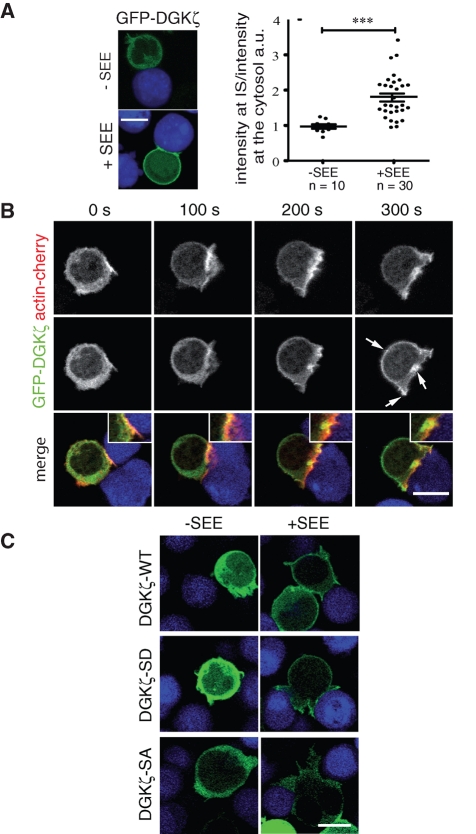
GFP-DGKζ translocates to the PM in response to APC-driven antigen presentation. (A, B) Jurkat T cells transfected with GFP-DGKζ alone (A) or cotransfected with actin-Cherry (B) were collected after 24 h in HBSS, 2% FBS in poly-l-lysine–coated chambers, and placed on a warmed microscope stage (37°C) for image acquisition; Raji B cells, alone or pulsed with 1 μg/ml SEE, were prestained with the fluorescent marker CMAC (blue) and added in droplets. (A) Representative images (left). Quantitative image analysis of GFP-DGKζ accumulated at the IS (right; see Materials and Methods). Each dot shows the synapse:cytosol intensity ratio for accumulated GFP-DGKζ constructs in a T cell after APC encounter. Bars, mean ± SEM (***p < 0.001; Kolmogorov–Smirnov test). (B) Dynamic translocation of GFP-DGKζ (green) with actin-Cherry (red) in the presence of SEE-pulsed APC (blue). Arrows, DGKζ accumulation; time 0 represents first cell–cell contact. Bar, 10 μm. (C) Translocation of DGKζ wild type (WT) vs. MARCKS-domain mutants (SD, SA) after antigen presentation. At 48 h posttransfection, Jurkat T cells were collected and incubated with APC; representative confocal images of live cells are shown.

