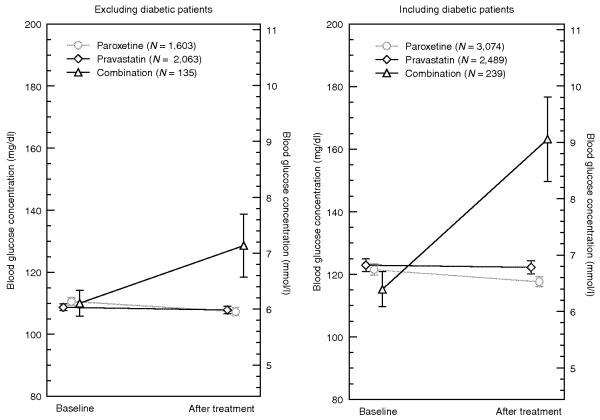
Figure 3.
Mean baseline and post-treatment blood glucose concentrations with 95% confidence intervals for a combined analysis of data from the three independent sites. The left panel shows the analysis excluding data relating to patients with diabetes, and the right panel shows the analysis including such data. Both combination cohorts (triangles) had significantly increased random blood glucose levels: 18.5 mg/dl (1.0 mmol/l), P < 0.001 after excluding data from patients with diabetes, and 48 mg/dl (2.7 mmol/l), P < 0.001 after including these data. No significant changes in glucose levels were observed in the pravastatinonly (diamonds) cohorts. A slight decrease in glucose levels was observed in the paroxetine-only (circles) cohorts in both analyses: −3.3 mg/dl (−0.2 mmol/l), P < 0.001, after excluding data from patients with diabetes, and −4 mg/dl (−0.2 mmol/l), P < 0.001 after including these data (Table 3).

