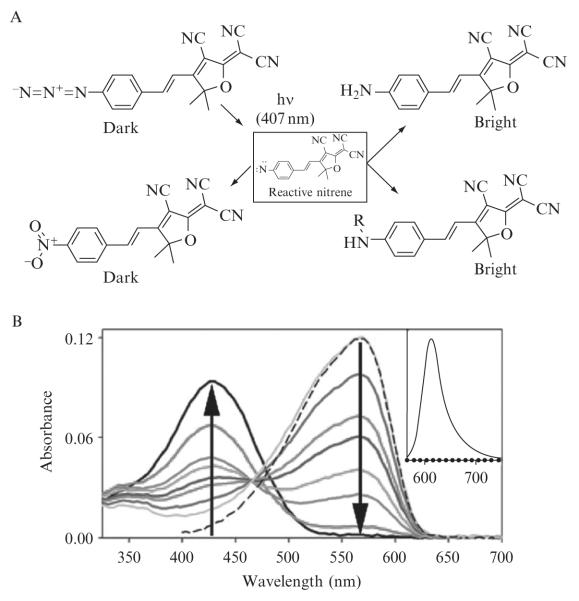
Figure 2.1. Photochemistry and spectroscopy of an azido DCDHF fluorogen.
(A) Various products resulting from photochemical conversion of an azido DCDHF fluorogen. (B) Absorption curves in ethanol (bubbled with N2) showing photoactivation of 1 (λabs = 424 nm) over time to fluorescent product 2 (λabs = 570 nm). Different colored curves represent 0, 10, 90, 150, 240, 300, 480, and 1320 s of illumination by 3.1 mW cm−2 of diffuse 407-nm light, where the arrows show the direction of increasing time. The sliding isosbestic point may indicate a build-up of reaction intermediates. Dashed line is the absorbance of pure, synthesized 2. (Inset) Dotted line is weak preactivation fluorescence of 1 excited at 594 nm; solid line is strong postactivation fluorescence resulting from exciting 2 at 594 nm, showing > 100-fold turn-on ratio. (Adapted and reproduced with permission from Lord et al.,2008. Copyright 2008 American Chemical Society.)

