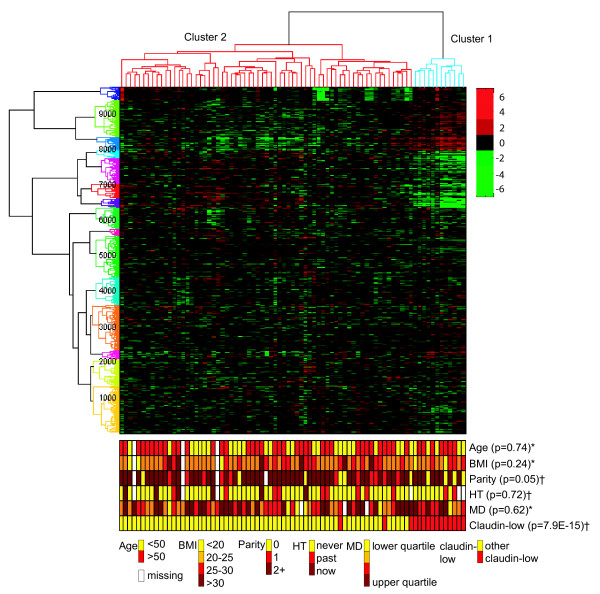
Figure 1.
Unsupervised hierarchical clustering of 79 samples from healthy individuals and 9767 genes filtered on variation. Phenotypes with tests for significant difference in values between cluster 1 (blue) and cluster 2 (red). Continuous variables are categorized for the illustration, but significance tested as continuous variables. P-values from two-sided t-tests assuming equal variance for continuous variables (*) and chi-squared tests (**) for categorical variables are given. The numbers along the y-axis denotes the number of genes. Age = Age at time of inclusion. BMI: Body mass index. HT: Use of hormone therapy. MD: Mammographic density.

