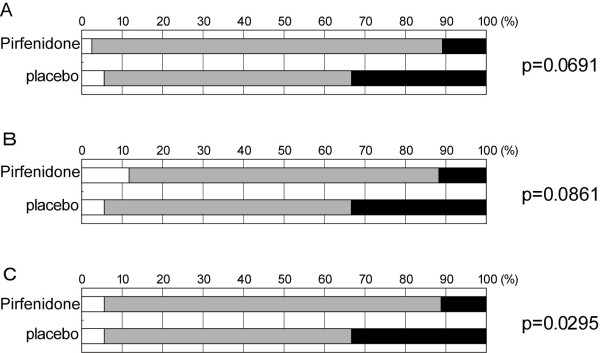
Figure 1.
Categorical changes in VC from baseline to week 52 in Subgroup A [baseline %VC ≥ 70 and the lowest SpO2 < 90]. A) High-dose vs Placebo groups, B) Low-dose vs Placebo groups, C) pirfenidone-treated (High + Low-dose) vs placebo groups. (The changes in VC are rated as follows: improved, VC ≥ 10% increase; stable, VC < 10% change; worsened, VC ≥ 10% decline). The white, gray, and black areas indicate improvement, stability, and deterioration, respectively. The p-values of Wilcoxon rank sum test are indicated on the right.

