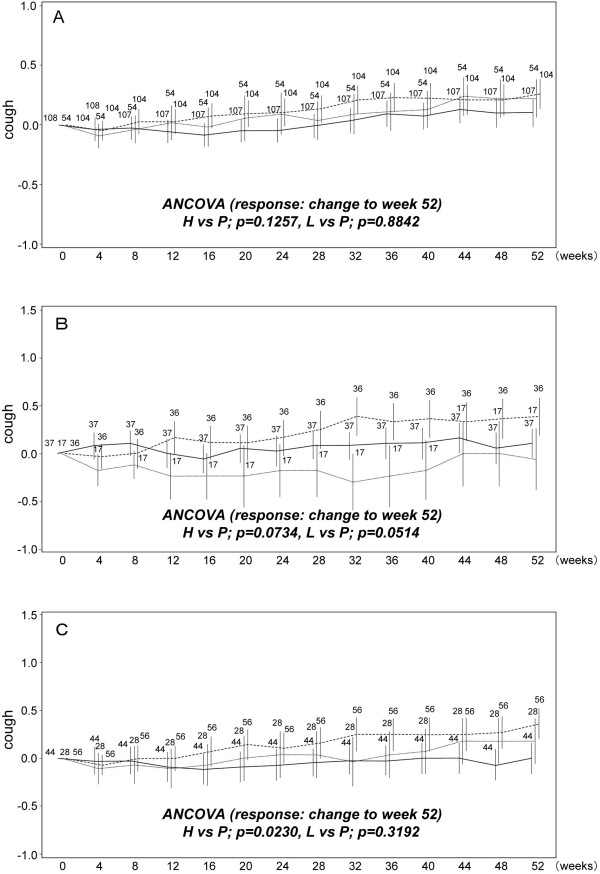
Figure 2.
Temporal changes in cough score in subpopulations. A) Full analysis set (FAS; all patients), B) Subgroup A [%VC ≥ 70 and the lowest SpO2 < 90], and C) Subgroup B [PaO2 ≥ 70 and the lowest SpO2 < 90]. Data are shown as mean ± SE. High-dose (solid line); low dose (dashed line); placebo (dashed line in bold). The mean changes from baseline to week 52 were compared between high (or low-dose) and placebo groups with ANCOVA.

