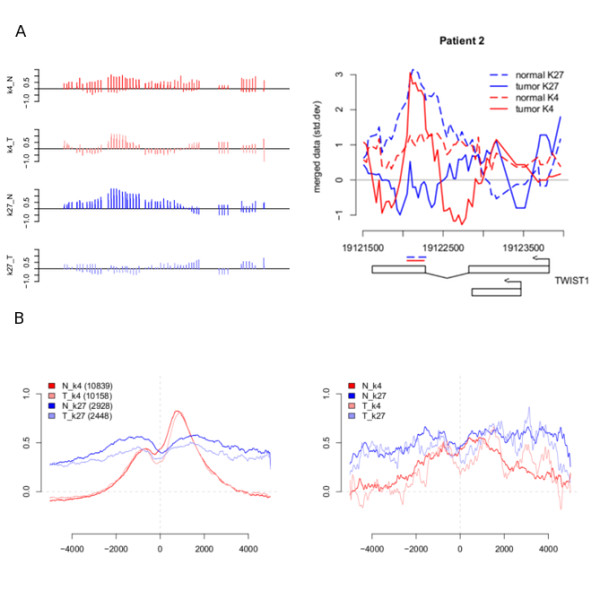
Figure 1.

ChIP-chip signals. (A) Signal example from the TWIST1-gene (chr7) with data from patient 2. Left panel shows individual probes in replicates for all signals after analysis in TAS. Right panel shows normalized and averaged signal in terms of standard deviations (y-axis). Detected regions and location (HG18) of the TWIST1 gene is also marked out. (B) Footprints of normal and tumor K4/K27 signal in patient 1 around the TSS's (left) of genes associated with enriched regions in each group separately and centred around genes associated with bivalent regions (right) in normal and tumor respectively.
