Figure 1.

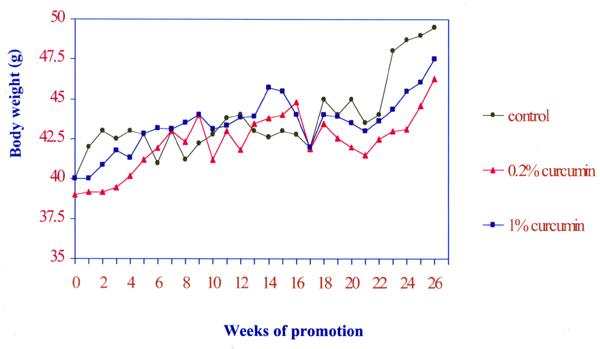
Changes in body weight in Swiss mice treated with control, 0.2% and 1% curcumin diets. Each point represents the mean value (N=20).

Changes in body weight in Swiss mice treated with control, 0.2% and 1% curcumin diets. Each point represents the mean value (N=20).