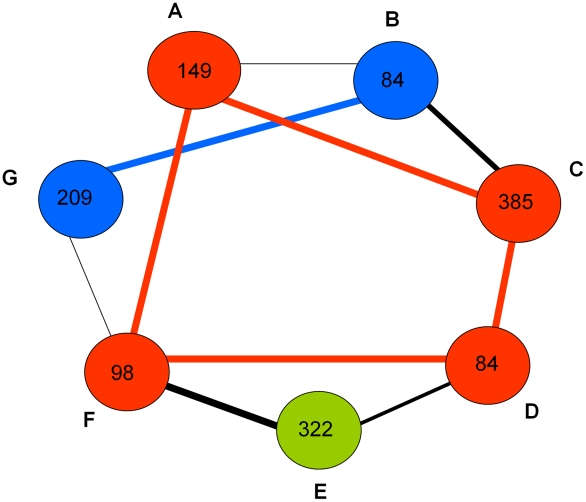
Figure 3. A simplified illustration of inter-modular networking of Aedes aegypti genes responsive genes.
The expression modules are shown by colored circles (A through G). The number of genes belonging to each module is shown. The black lines connect the modules. The thickness of these line shows how closely similar they are to each other in the cluster tree (see Figure 1). The red colored circles and lines represent the refractory response modules (RRM), the green color circle represents the susceptible response module (SRM) and the blue colored circles and lines represent the core response modules (CRM).

