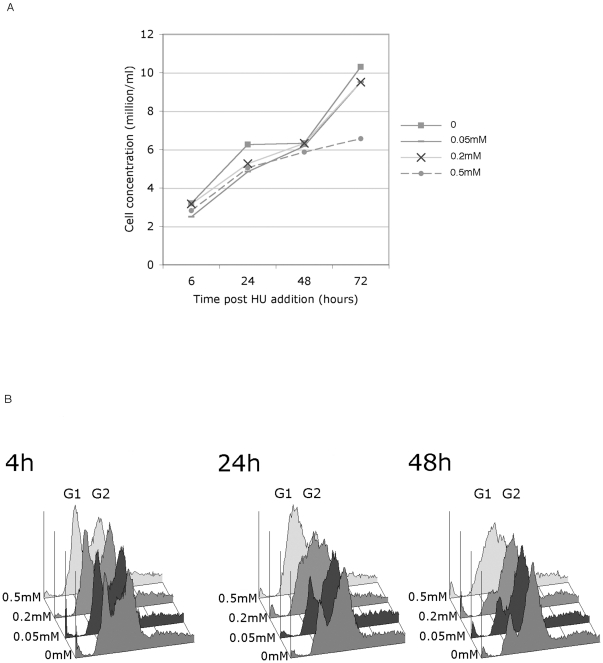
Figure 4. Effect of increasing concentrations of HU on S2 cells.
(A)Titration of the proliferation rate of S2 cells treated with different levels of HU. 0 HU (□), 0.05 mM HU (-), 0.2 mM HU (X) and 0.5 mM HU (•) as shown were added to log phase S2 cells and the proliferation rate of the cells was determined by cell counting at 6, 24, 48 and 72 h. Consistent results were obtained with several independent experiments and this figure presents data from one representative experiment. (B) FACS analysis showing the effect of titrating HU into Drosophila S2 cells. Log phase S2 cells were either left untreated or 0.05 mM HU, 0.2 mM HU and 0.5 mM HU as shown (front to back) were added at time = 0 and the cell cycle state of the cells was determined by FACS at 4, 24, and 48 h. Consistent results were obtained with several independent experiments and this figure presents data from the same representative experiment as Figure 4A.

