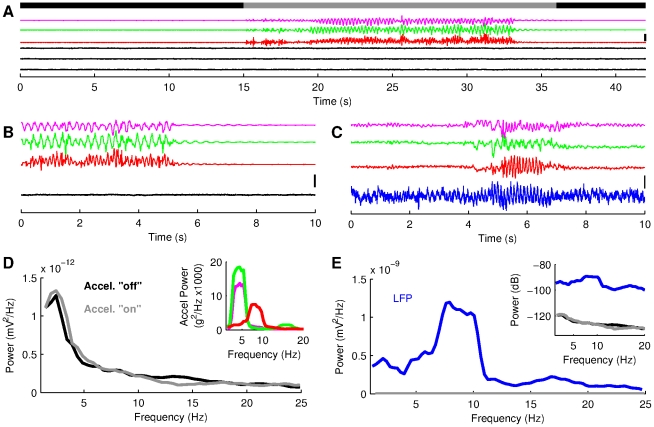
Figure 2. Signals generated by the accelerometer do not interfere with the neurophysiological recording apparatus.
(A) Recording from a saline container (black traces) while the accelerometer is moved manually in an oscillatory manner at proximity of the recording sites. The time intervals during which the accelerometer were immobile and moved are represented respectively by the black and gray segments of the upper bold line. The colored traces show the signals generated by the accelerometer (pink, green and red for respectively the anteroposterior, mediolateral and dorsoventral axes). (B) 10 seconds epoch from A. (C) 10 seconds recording epoch taken around a single trial performed by Rat 1. Blue trace represents CA1 LFP. (D) Spectral density functions from the recording shown in A, during and around movements of the accelerometer. Inset shows the spectral density functions of the 3 accelerometer signals when the accelerometer was moved. (E) Spectral density functions of the hippocampal LFP (from data shown in C) and of the saline recordings (same than D). Note the different y-axis scales in D and E. Inset shows the same data using a logarithmic scale for the y-axis, to visualize saline recording power spectrum. The vertical scale bars in A, B and C represent 0.5 mV for the LFP and saline recordings and 1.6 g for the acceleration signals respectively.

