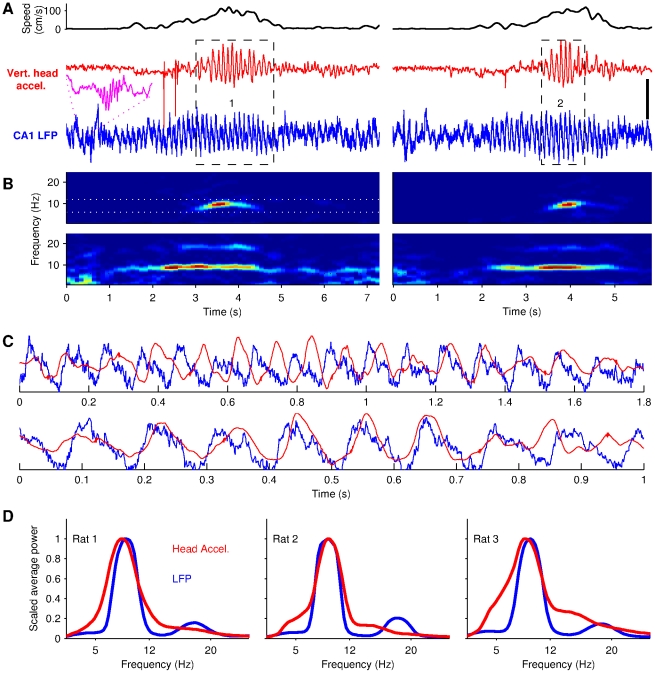
Figure 3. Head acceleration and LFP oscillate at theta frequency during running.
(A) Simultaneously recorded vertical acceleration of the rat's head (red) and CA1 hippocampal LFP (blue), before, during and after two runs across the maze (Rat 2, same recording session). Top black traces show the running speed of the animal. Magenta inset shows a ripple. Data in the dashed rectangle are magnified in C. (B) Time-frequency power spectra of the acceleration (upper row) and LFP (lower row) signals shown in A. White dotted lines show the limits of the 6–12 Hz theta band. (C) Superposition of LFP and acceleration signals (scaled) when head oscillations are prominent. Upper and lower traces are taken respectively from dashed rectangles 1 and 2 in A. (D) Average power spectra of the LFP (blue) and head acceleration (red) during all the trials recorded for the three rats (Rat 1 to 3 are shown from left to right). The vertical scale bar in A represents 0.5 mV and 2.4 g for, respectively, the LFP and acceleration signal.

