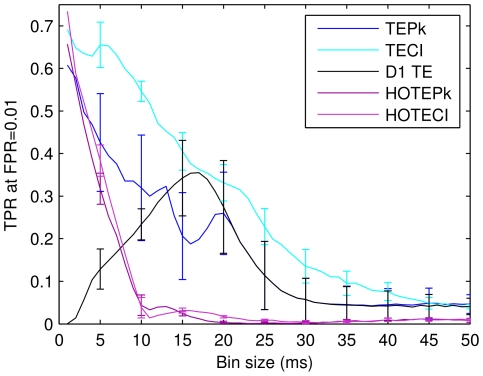
Figure 6. Short bin widths generally improve performance.
Comparison of connectivity measures at different bin sizes. The true positive ratio of all measures (taken at FPR = 0.01) is plotted against bin sizes ranging from 1 to 50 ms. The performance of most measures peaks at 1 ms bin size, except for D1TE, which peaks at 17 ms bin size. For HOTEPk, we used order k = 1, l = 3, and for HOTECI, k = 3, l = 2. These parameters were selected because they maximized performance for 1 ms bins. The order was not optimized for larger binning sizes (see text). Beyond 25 ms, performance of all the measures is very low suggesting that one needs high temporal resolution to see effective connectivity between neurons. Error bars indicate standard deviations from 8 simulations, and are shown only every 5 ms for clarity.

