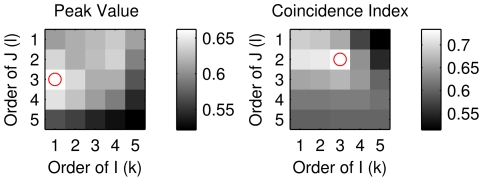
Figure 7. Optimization of higher-order TE (HOTE).
With HOTE, the message length of presynaptic neuron J ‘s history (l) and postsynaptic neuron I ‘s history (k) could vary from 1 to 5. We measured the true positive ratio, TPR, at a false positive ratio of FPR = 0.01 for all the combinations of l and k for simulated data binned at 1 ms. The best combination of l and k is indicated by a red circle. For HOTEPk (left plot), k = 1, l = 3 was best, and for HOTECI (right plot), k = 3, l = 2 was best. TPR values are indicated by grayscale bars at the right of each plot.

