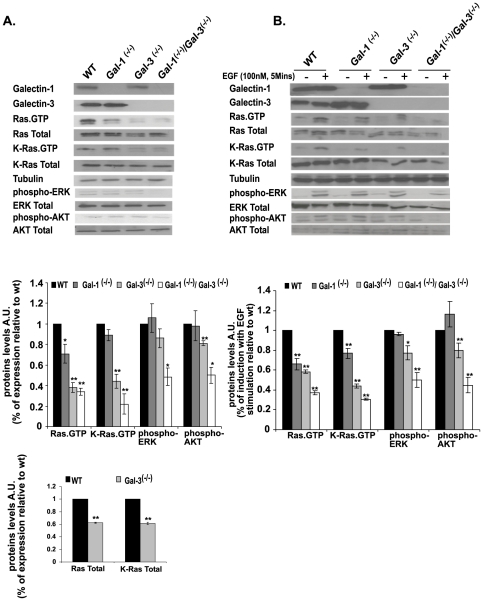
Figure 1. Gal-1- and Gal-3-knockout and Gal-1/Gal-3 double-knockout mouse embryonic fibroblasts express low levels of Ras.GTP.
Gal-1-/-, Gal-3-/-, Gal-1-/-/Gal-3-/-, and wild-type (wt) MEFs were homogenized as described in Methods. Expression levels of Gal-1, Gal-3, Ras.GTP, total Ras, K-Ras.GTP, total K-Ras, and the Ras downstream effectors ERK, phospho-ERK, Akt, and phospho-Akt were determined in aliquots of the homogenates by SDS–PAGE followed by immunoblotting with the relevant specific antibodies, as described in Methods. β-Tubulin served as a loading control. Shown are typical immunoblots visualized by ECL. A. MEFs were grown in medium containing 10% fetal calf serum (FCS). B. MEFs were grown in medium containing 0.5% FCS, and then stimulated for 5 min by 100 nM EGF. Upper panels in A and B represent typical immunoblots representing expression levels of Gal-1, Gal-3, Ras.GTP, Total Ras, K-Ras.GTP, Total K-Ras, β-tubulin, phospho-ERK, Total ERK, phospho-Akt and Total Akt in wt, Gal-1-/-, Gal-3-/-, and Gal-1-/-/Gal-3-/- MEFs. Statistical analysis of the levels of Ras.GTP, K-Ras.GTP, phospho-ERK and phospho-Akt in the different MEF genotypesis shown in the histograms of the middle panels (means ± SEM, n = 3 *p<0.05, **p<0.001). Genotypes are marked by colors of the columns for wt (black), Gal-1 -/- (dark gray), Gal-3-/- (light gray) and Gal-1-/-/Gal-3-/- (white). Lower panel in A shows histograms of Total Ras and Total K-Ras levels in wild type and in Gal-3-/- MEFs (means ± SEM, n = 3). AU, arbitrary units; MEFs, mouse embryonic fibroblasts; wt, wild type.

