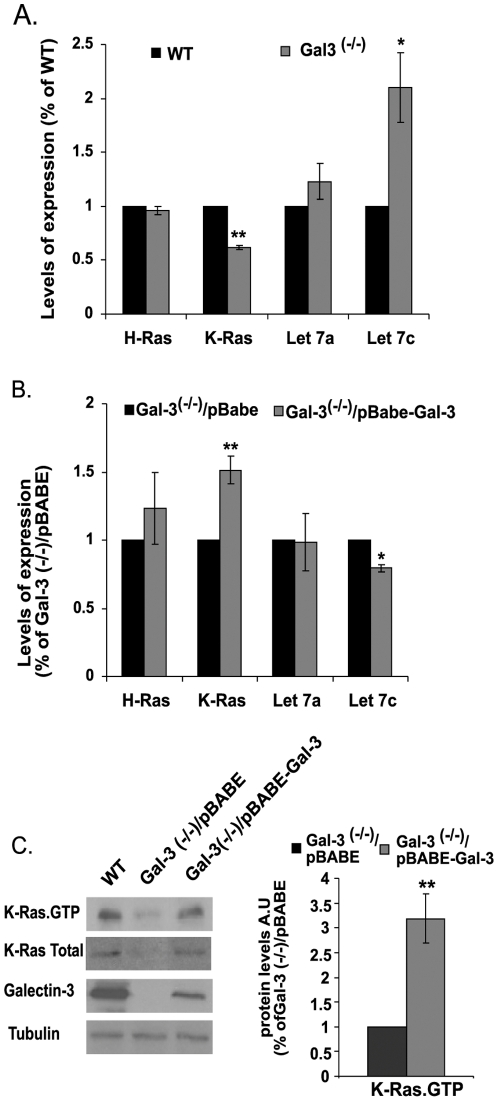
Figure 5. Control of K-Ras transcription and expression by Gal-3 via let-7c.
The relative amounts of let-7a and let-7c miRNAs and of K-Ras and H-Ras transcripts were determined in: (A) Gal-3-/- and wt MEFs; (B) Gal-3-/- MEFs re-expressing Gal-3 (Gal-3-/-/pBABE-Gal-3) and Gal-3-/- MEFs expressing pBABE only. Quantities of the miRNA were normalized to U6 snRNA levels, while the quantities of H-Ras and K-Ras transcripts determined by RT-PCR were normalized to levels of the endogenous housekeeping gene B2M (n = 6, *p<0.05, **p<0.001). C. Immunoblots of Gal-3, K-Ras total and K-Ras.GTP from wt, Gal-3-/-/pBABE and Gal-3-/-/pBABE-Gal-3 MEFs. Cells were homogenized and expression levels of K-Ras.GTP, total K-Ras, and Gal-3 were determined in aliquots of the cell homogenates by SDS-PAGE followed by immunoblotting with the relevant specific antibodies (see Methods). β-Tubulin served as a loading control. Left panel, typical immunoblots visualized by ECL. Right panel, levels of K-Ras.GTP expression (means ± SEM, n = 3, **p<0.001). AU, arbitrary units; wt, wild type.

