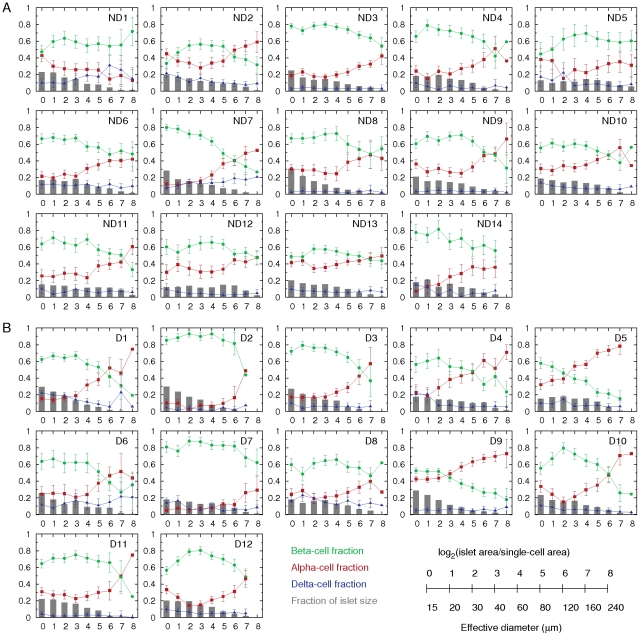
Figure 5. Individual islet size distribution and cellular compositions.
A: In non-diabetic subjects (ND1–ND14), relative frequency of islet size (gray bar) and ratios of alpha (red), beta (green), and delta (blue) cells within islets were plotted against islet size; means ± SEM. B: Results in T2D patients (D1–D12). Note that islet size is presented as a logarithmic scale considering the high number of small islets and the low number of large islets. In addition, we divided islet areas by the single-cell area, 170 µm2 [29], to make them as dimensionless values representing the number of cells in a given islet area. The conversion between logarithmic islet area (logarithmic) and effective diameter (µm) is shown.

