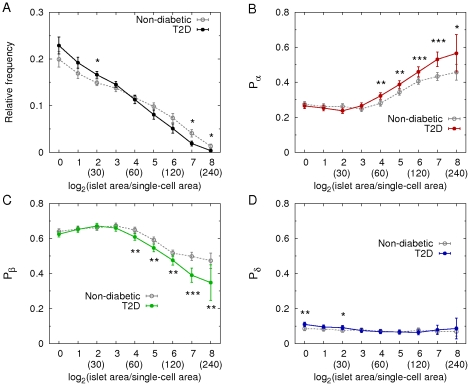
Figure 6. Changes of islet size and cellular compositions in T2D.
A: Mean relative frequencies of islet sizes and cellular compositions (B: alpha-cell fraction, C: beta-cell fraction, and D: delta-cell fraction) depending on islet size in non-diabetic (gray; 8903 islets with n = 14) and T2D (color; 7929 islets with n = 12) subjects (mean ± SEM). The numbers in parentheses represent effective islet diameters (µm) corresponding to the given logarithmic dimensionless islet areas. Student's t-test compared the results between non-diabetic and T2D subjects at each size bin with *P<0.05, **P<0.001, and ***P<0.0001.

