
Figure 3.
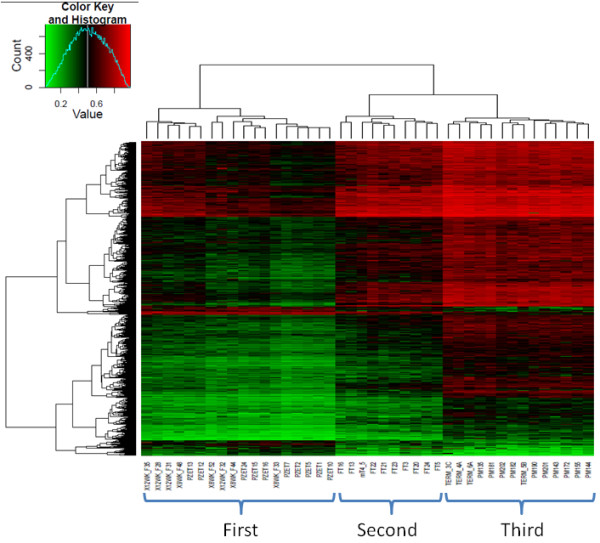
Unsupervised clustering based on probes with Δβ > 0.2 between First and Third trimester. HeatMap showing unsupervised clustering of all placenta samples (x-axis) based on 954 probes with a Δβ > 0.2 between First and Third trimester (y-axis). The majority of differentially methylated probes show higher methylation in third trimester (883 probes) compared to only 71 probes with lower methylation in third trimester. Second trimester placentas cluster as a separate group, and show a methylation profile that is an intermediate of first and third trimesters. Green corresponds to low methylation and Red to high methylation.