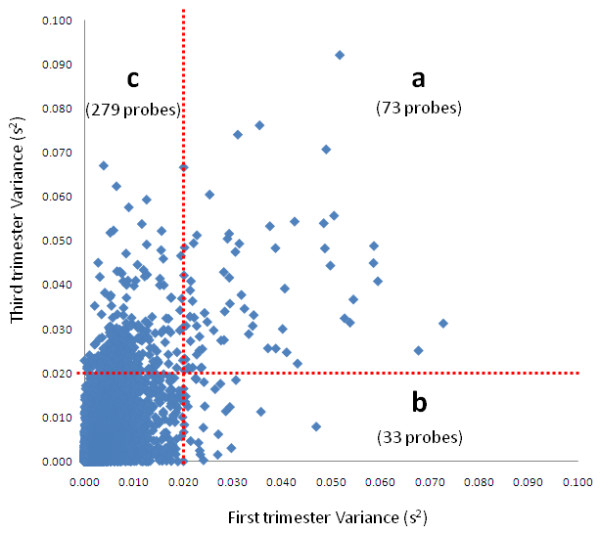
Figure 5.

Variance levels of probes in the third compared to the first trimester. Scatter plot of probe variance (s2) at first trimester (x-axis) and third trimester (y-axis). Dots represent individual probes and the vertical red dotted line marks s2 = 0.02 for first trimester, while the horizontal red dotted line marks s2 = 0.02 for third trimester. Probes on the outside of the red line are deemed 'variable'. This analysis revealed that there are 73 probes (A) which are highly variable in both first and third trimester. Only 33 probes (B) were variable in first, but not third trimester, while 279 probes (C) were variable in third, but not first trimester. This analysis suggests that most of the variable probes become so throughout pregnancy, supporting the hypothesis that accumulating environmental factors contribute to inter-individual variation in DNA methylation, in term placenta.
