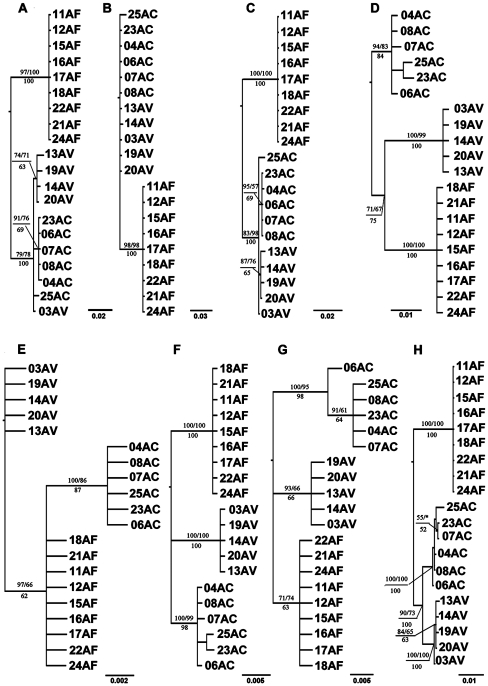
Figure 1. Phylogenetic cladogram of the Altica based on different gene combines.
The values above the branches represent Bayesian posterior probabilities and Maximum Likelihood bootstrap support values, respectively. The values below the branches represent Maximum Parsimony bootstrap support values. The outgroup AK was moved away. Nodes with ≥50% bootstrap value or posterior probability are labelled. a. based on COI, b. based on COII, c. based on COI/COII, d. based on intron of EF1α, e. based on exon of EF1α, f. based on whole EF1α, g. based on ITS2, h. based on concatenated data.

