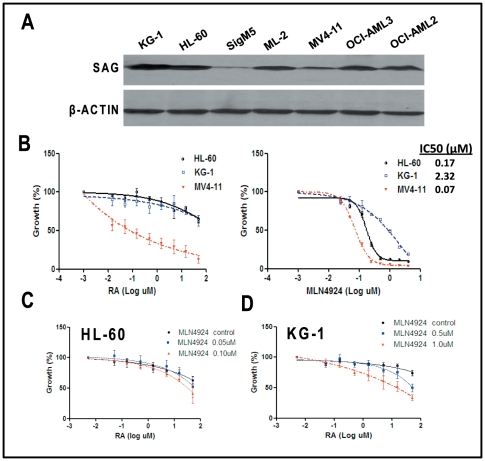
Figure 4. Correlation between SAG overexpression and RA resistance in AML cell lines and their sensitivity to RA and/or MLN4924.
Proteins were extracted from 7 AML lines and subjected to immunoblotting using antibody against SAG with β-actin as the loading control (A). Cells were seeded in 96-well plate in triplicate and treated with various concentrations of RA (B, left panel), MLN4924 (B, right panel) or in combination at indicated concentrations of each drug for 48 hrs (C, HL-60 cells) and (D, KG-1 cells), followed by ATP-lite cell viability assay. Values were normalized to the untreated control. Shown is x ± SEM from three independent experiments with IC50 curve generated and IC50 value calculated using the Prism software.

