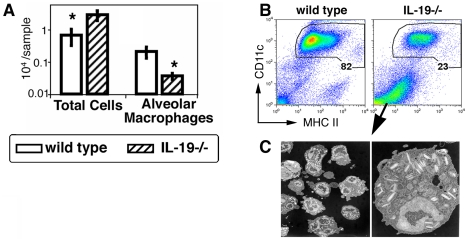
Figure 1. Decreased abundance of CD11c+ cells in the BAL of naïve IL-19-/- 129xBL6 mice.
(A) Bar graphs (white – wild-type, striped – IL-19-/-) show means and SEM of numbers of total cells and CD11c+ cells in the BAL. One representative independent experiment of 5 is shown (n = 4-5 per group per study), *p<0.05, Mann-Whitney-U test. (B) Dot plots show CD11c versus MHCII staining of BAL cells. The percentages of the gated CD11c+ cells are indicated. One representative of 20 independent experiments is shown. (C) Electron micrographs of marker negative cells in IL-19-/- mice. The marker negative cells were purified by cell sorting from a pool of BAL samples from groups of 20 to 25 mice of each genotype: wild type or IL-19-/-. Note that cells from the BAL of IL-19KO mice were eosinophils. Only debris was harvested from the BAL of wild type mice (not shown).

