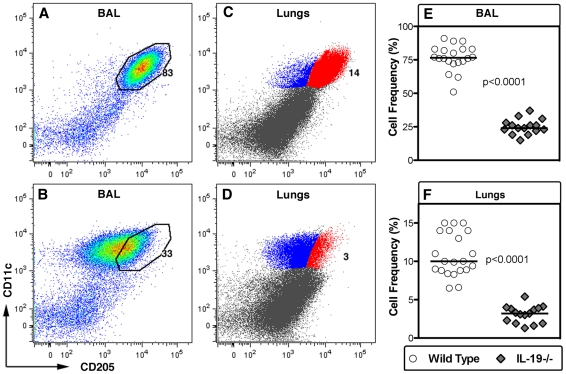
Figure 5. IL-19 regulates the relative size of the CD205+ subset of CD11c+ cells in the airways and lungs of naïve mice.
(A-D) The dot plots show CD11c (y-axis) vs. CD205 (x-axis) staining of BAL (A, B), and lung (C, D) cells. Representative plots from naïve wild type (A, C, n = 21) and IL-19-/- (B, D, n = 16) C57BL/6 mice are shown. The percentage of cells that express CD11c and CD205 at high levels is indicated. (E, F) Group comparisons of naïve C57BL/6 wild type (circles) and IL-19-/- (gray diamonds) mice for percentages of CD11c+ CD205+ cells in the BAL (E) or in cell suspensions prepared from the lung parenchyma (F). Individual data points that were pooled from two experiments are shown. Horizontal lines indicate medians. Significance levels were calculated with the Mann-Whitney-U test. Note that the numbers of CD11c+ cells in the BAL and lungs of wild type and IL-19-/- mice were similar (Table S2).

