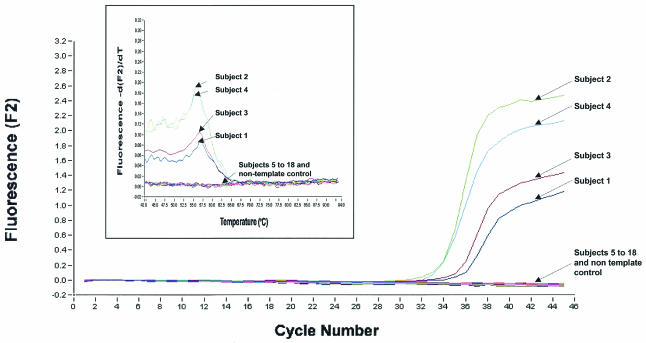
FIG. 2.
Detection of SARS CoV from 18 subjects by real-time quantitative PCR. Data for RNA from 18 subjects are shown. The viral load is indicated as number of copies per ml of blood. Subject 1, 2,020 copies; subject 2, 9,100 copies; subject 3, 3,120 copies; subject 4, 9,600 copies. A sample would be considered positive if it generated a typical amplification curve within the 45 cycles. Negative signals from subjects 5 to 18 and the nontemplate control (water) are shown. The inset graph shows melting-curve analysis of the PCR products from the 18 subjects. The x axis denotes the temperature (oC), and the y axis denotes the fluorescence intensity (F2) over the background level.

