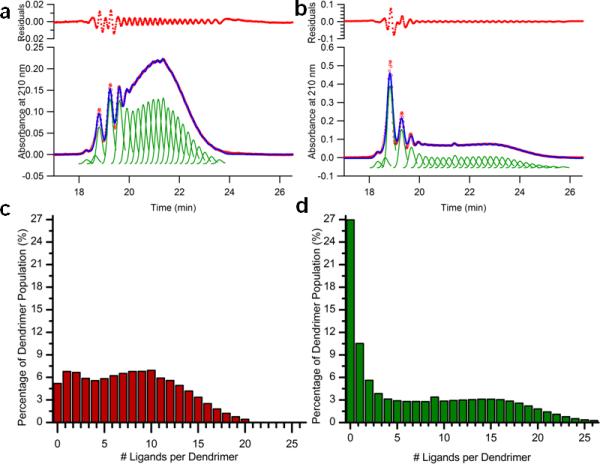
Figure 7.
Quantified distributions of two ligand-dendrimer conjugates with mean ligand/dendrimer ratios of 6.6 ± 0.7 (a and c) and 6.8 ± 0.7 (b and d). Although the samples have the same arithmetic means, they have dramatically different distributions of ligand-dendrimer components. The dendrimer samples were produced using two different batches of partially acetylated dendrimer and the differences in ligand-dendrimer distributions were found to be caused by differences in dendrimer-acetyl group distributions in the parent partially acetylated dendrimer batches. For the sample in panel a and c, the parent partially acetylated dendrimer was produced under effective mass transport conditions. The parent dendrimer for the sample in b and d was produced with ineffective mass transport during the partial acetylation reaction. Residuals are ×10−6. (From Mullen et al. Macromolecules 2010)

