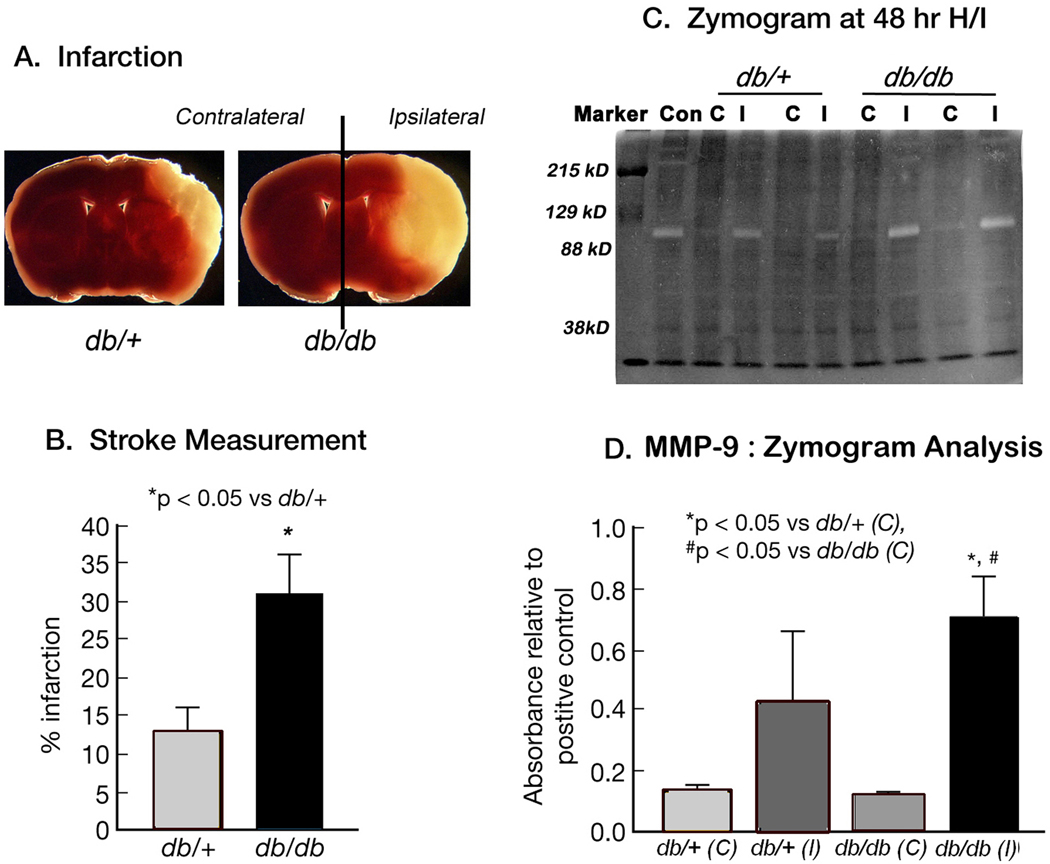
Figure 2. MMP-9 gelatinolytic activity following H/I: Zymogram Analysis.
Figures 2A & 2B illustrate typical cell loss in db/+ and db/db mice brains by TTC staining following 48 hr H/I. The corresponding results are expressed as percentage area of infarction in Figure 2B. Data are mean ± SEM (n=23–24/ group). *p<0.05 vs db/+.  db/+ ■ db/db
Figure 2C represents a typical zymogram obtained from extracts of contralateral (C) and ipsilateral (I) hemispheres of db/+ and db/db mice brain after 48 hr of hypoxic-ischemic recovery. A clear band was observed, at ~92kDa that corresponds to MMP-9 Fig. 2D illustrates significantly greater MMP-9 proteolytic activity in ipsilateral hemispheres of the db/db mice as compared to the db/+ mice. Results are expressed as mean ± SEM (n=3). Significance denoted as *p<0.05 vs db/+(C), # p<0.05 vs db/db (C).  db/+(C)
  db/+(l)
  db/db (C) ■ db/db (l)
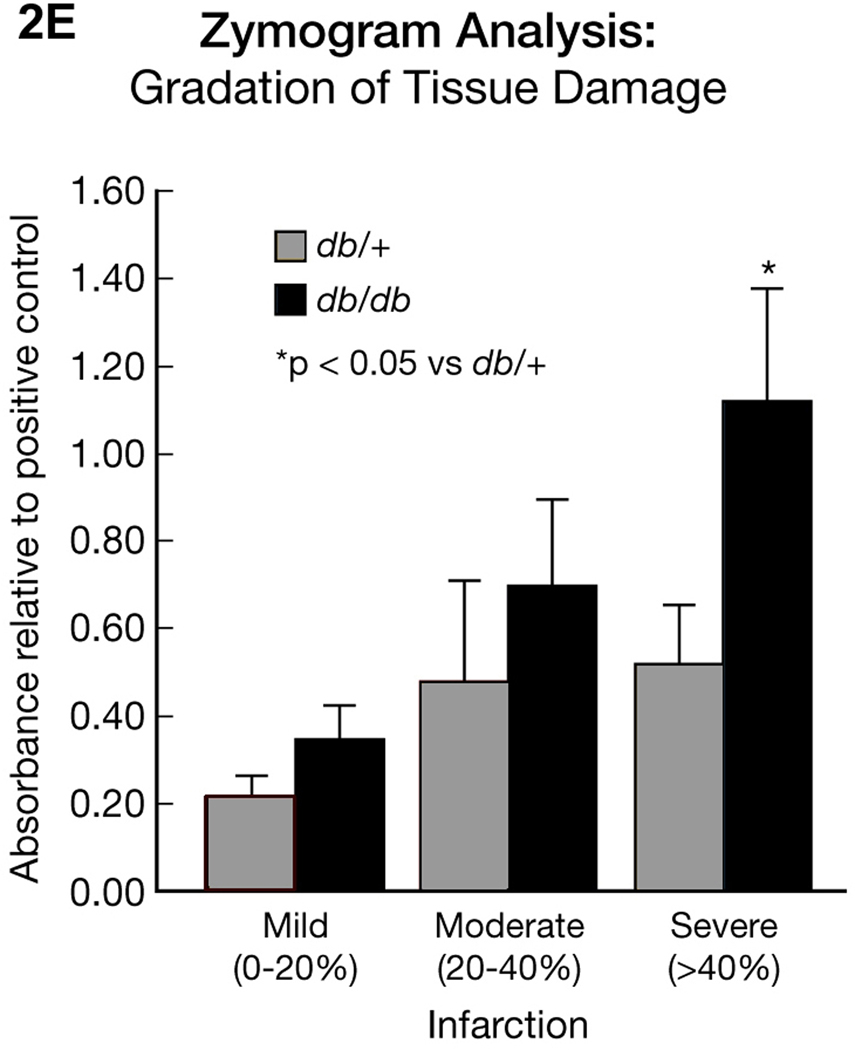
Figure 2E. Zymogram Analysis: Gradation of tissue damage.
Figure 2E provides a comparison of MMP-9 gelatinolytic activity in db/db and db/+ mice brains with different degrees of damaged tissue. Samples were selected based on the TTC measurement as described in Method section. Increased MMP-9 gelatinolytic activity is correlative with the percentage increase in infarction, but is significantly greater in the db/db. Results are expressed as mean � SEM (n=3–6/group). *p<0.05 vs db/+.  db/+ ■ db/db


