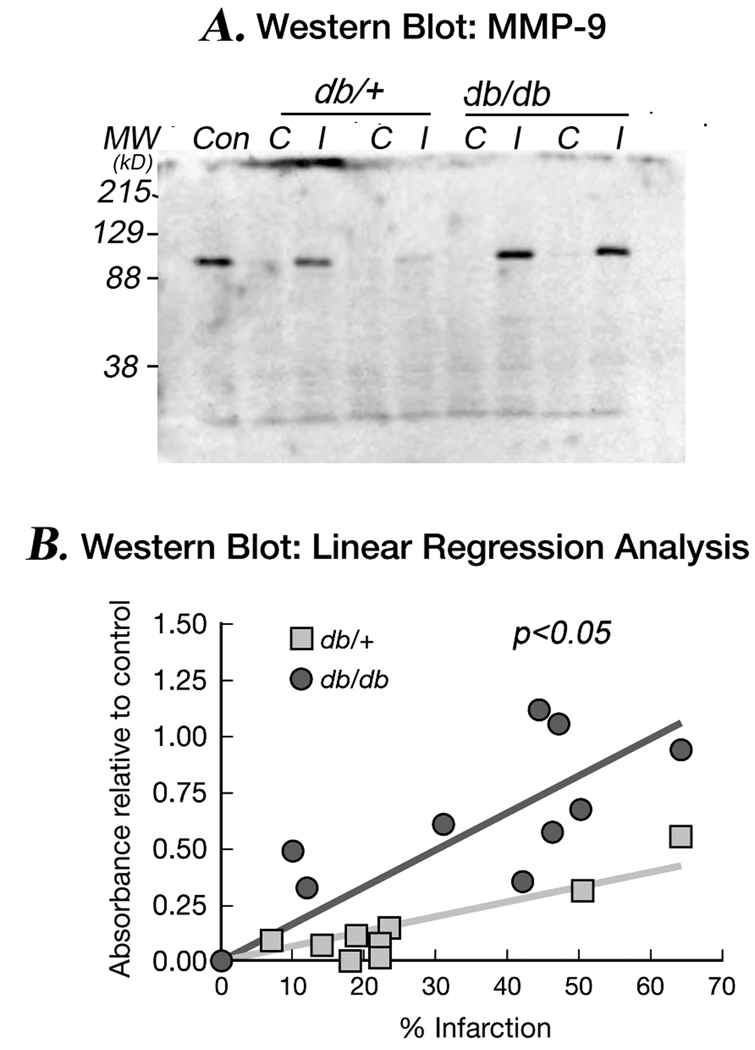
Figure 3. MMP-9 protein levels: Western blot analysis.
Figure 3A is a typical Western blot of MMP-9 protein expression in the contralateral (C) and ipsilateral (I) hemispheres of db/+ and db/db mice brain following 48 hr of H/I. The levels of MMP-9 are greater in ipsilateral hemispheres of db/db mice compared to db/+ and are detected earlier (not shown).
Figure 3B demonstrates a linear relationship between MMP-9 protein expression & tissue damage following stroke. A linear regression line was plotted for percentage infarction vs protein
expression in db/+ and db/db mice. The slope of the diabetic group was significantly greater than control. Two tailed null hypothesis was applied to find out the significance between two slopes. Result is expressed as mean ± SEM (n=9/group). *p<0.05 vs db/+.  db/+ ■ db/db

