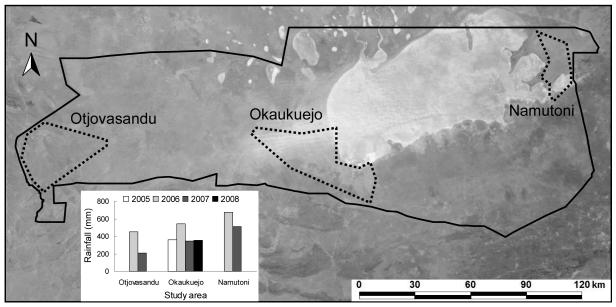
Figure 1.
Etosha National Park in northern Namibia. The three study areas are indicated with dashed lines. Okuakuejo was the main study area with intermediate rainfall values; Otjovasandu was the drier area and Namutoni the wetter area. The inset figure shows annual rainfall in the years each area was sampled. The satellite image from Terra MODIS shows the large Etosha salt pan (available from http://visibleearth.nasa.gov/view_rec.php?id=4009).

