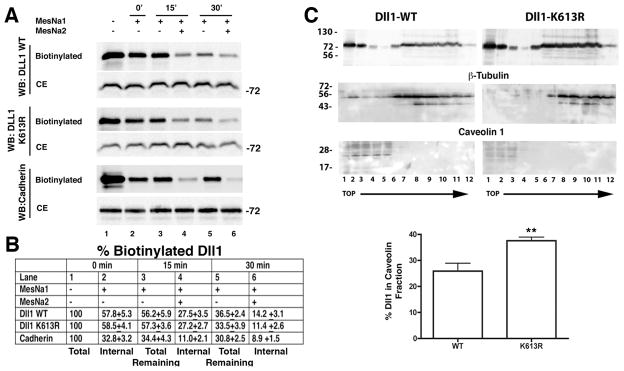
Figure 5. Mutation of Dll1 K613 does not alter membrane endocytosis or recycling, but does alter lipid raft localization.
A, HEK293 cells were transfected with plasmids for expression of wild type (WT) or mutant Dll1-K613R as indicated, and the trafficking of Dll1 between internal compartments and the plasma membrane was determined as described in “Materials and Methods” and supplementary figure S2. The biotinylated Dll1 in streptavidin fractions was detected using anti-Delta antibodies (sc-9102). Cadherins are known to undergo endocytosis and recycling and serve as a control. Cadherins were detected using an anti-Pan-cadherin antibody (CH-19). Shown are representative blots, n=3. CE, cell extract, represents 1/20th of the total cell extract prior to streptavidin fractionation; WB, western blot. B, Data shown in ‘A’ were quantitated from 3 separate experiments, and the percent ± SD (%) of biotinylated Dll1 present in each group shown. These values were determined by first normalizing the biotinylated Dll1 in the streptavidin fraction to the amount of Dll1 in the corresponding CE lane and then comparing this value to total biotinylated Dll1 (lane 1). C, Western blotting of HEK293 cells transfected with either wild type (WT) or K613R mutant Dll1. At 40 post-transfection, cells were mechanically lysed in buffer containing 1% Brij98 and then fractionated by ultracentrifugation through a sucrose step-gradient as described in “Materials and Methods”. Fractions were collected from top (fraction 1) to the bottom (fraction 12) of the gradient. Antibodies to β-tubulin (55 kDa), or caveolin-1 (24 kDa) were used to define cytoplasmic (detergent soluble) or lipid raft (detergent insoluble) fractions respectively, in the gradient. Bands were quantitated by densitometry and the percentage of Dll1 present in the caveolin positive fractions determined. Mean data ± SD obtained from 3–4 independent experiments are shown in the graph. **indicates statistical significance; p<0.05, Students t test.

