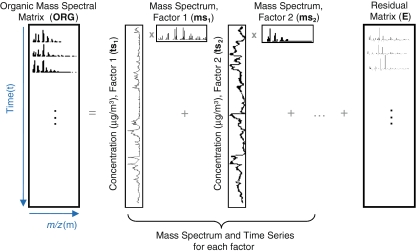
Fig. 1.
Schematic diagram of bilinear factor analysis of a mass spectral matrix of an organic aerosol (ORG). The time series of the factors (ts n) make up the matrix TS (Eq. 3) and the mass spectra of the factors (ms n) make up the matrix MS (Eq. 4). The differences between the measurements and the modeled results are represented as the residual matrix E. (Adapted from Ref. [38]). An example of the factor results obtained from PMF analysis of an ambient AMS dataset is shown in Fig. 2

