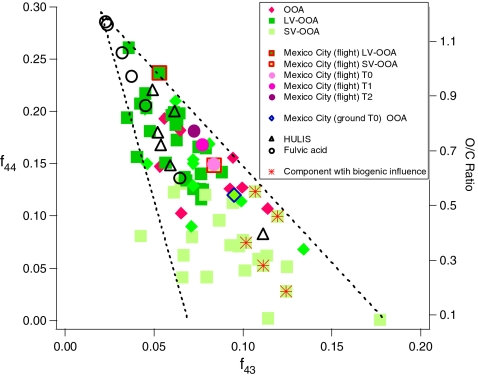
Fig. 11.
f
44 vs. f
43 in the mass spectra of ambient OOA and various HULIS and fulvic acid samples. The dotted lines define the triangular space where ambient OOA components fall. The O/C ratios were estimated using the formula given in Aiken et al. [31]:  (Adapted from Fig. 4 in Ref. [14], reprinted with permission)

