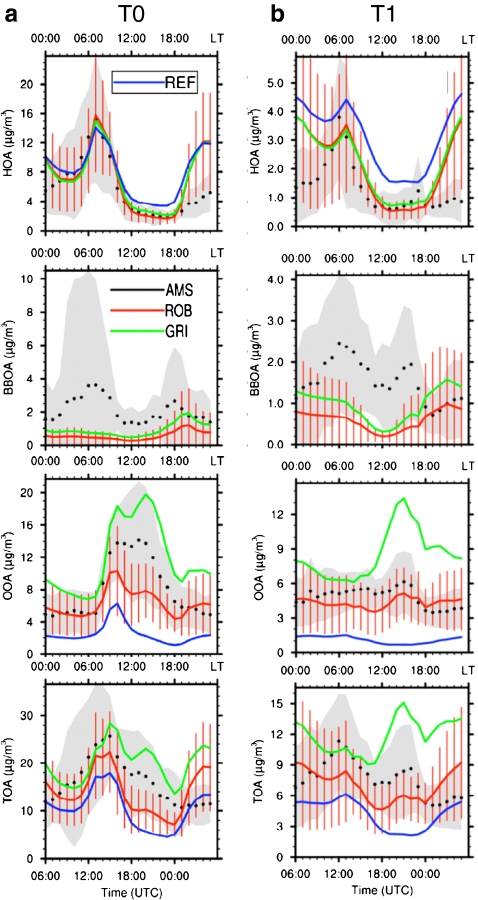
Fig. 12.
Average diurnal profiles of the model simulations (red, blue, and green lines) and the AMS measurements (black dots) at the (a) T0 (urban center site) and (b) T1 (downwind suburban site) for the MILAGRO field experiment in Mexico City for the concentrations of HOA, BBOA, OOA, and total OA. The REF model case represents POA as non-volatile and only accounts for SOA formation from aromatic species. The ROB (red line) and GRI (green line) cases consider POA as semi-volatile and also account for SOA formation from semivolatile and intermediate volatility species (see text). The variability associated with average observations and ROB model predictions is given in the gray shaded area and red vertical bars, respectively. (Adapted from Ref. [120], reprinted with permission)

