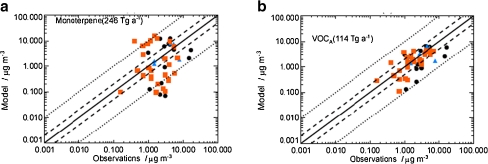
Fig. 13.
Scatterplot of simulated (GLOMAP) versus observed (AMS; data shown in Fig. 9) OOA data using (a) the initial biogenic dominated model and (b) the final optimized model. Observation locations are classified as urban (black circles), urban-downwind (blue triangles), and rural and/or remote (red squares) as in Zhang et al. [6]. The 1:1 line (solid), 2:1 lines (dashed), and 10:1 lines (dotted) are shown. (Figs. 3d and 4d, respectively, in Ref. [126]. Copyright 2011, reprinted with permission)

