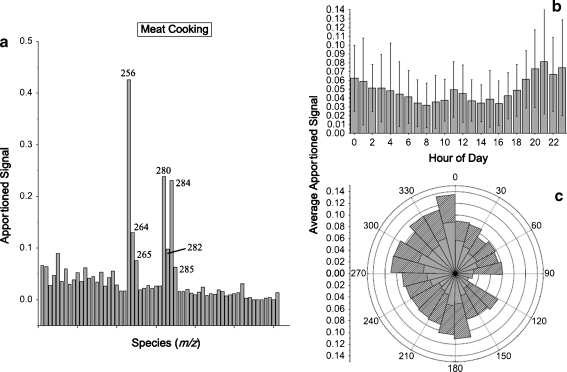
Fig. 4.
A meat cooking factor obtained via PMF analysis of a photoionization aerosol mass spectrometer (PIAMS) dataset acquired in fall, 2007, in Wilmington, Delaware, USA. (a) Apportioned signal vs. m/z; (b) diurnal profile (error bars show the standard deviation of the range of values at each time point); (c) wind rose plot for high-impact periods (outer plot) and all data points (inner plot). (Fig. 3 in Ref. [34] Copyright 2009. Elsevier, reprinted with permission)

