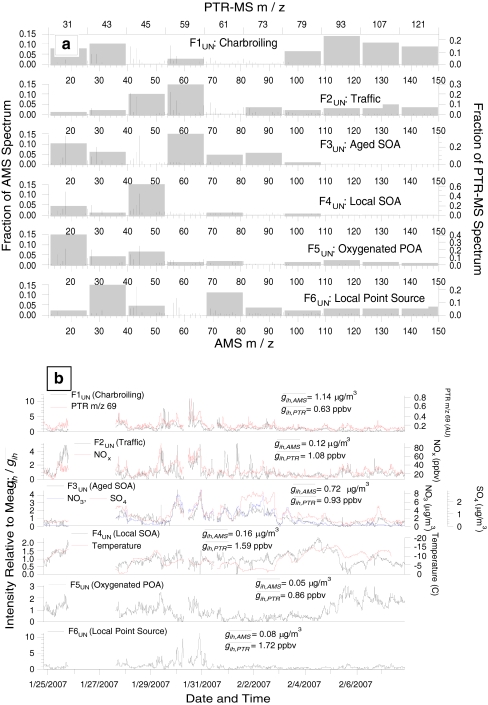
Fig. 7.
PMF analysis results of a unified dataset of AMS and PTR-MS measurements acquired in winter, 2007, from Toronto, Canada. Mass spectra (a) and time series (b) of the PMF factors (black traces, left axis) and selected tracer species (colored traces, right axis). The time series of PTR-MS m/z 69 is plotted in arbitrary units. (Figure 11 in Ref. [50], reprinted with permission)

