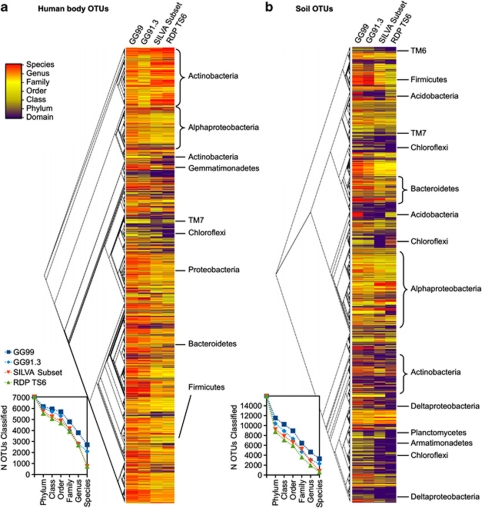
Figure 2.
Summary of OTU classification depth using each of the three training sets for two of the four studies: (a) human body OTUs, and (b) soil OTUs (other three data sets shown in Supplementary Figure S6). OTUs are organized according to evolutionary history, as determined by the FastTree approximately-maximum-likelihood tree constructed in the default QIIME pipeline. Inset charts summarize the total number of OTUs classified at each taxonomic level (GG99=dark blue, GG91.3=light blue, SILVA=green, RDP TS6=orange).

