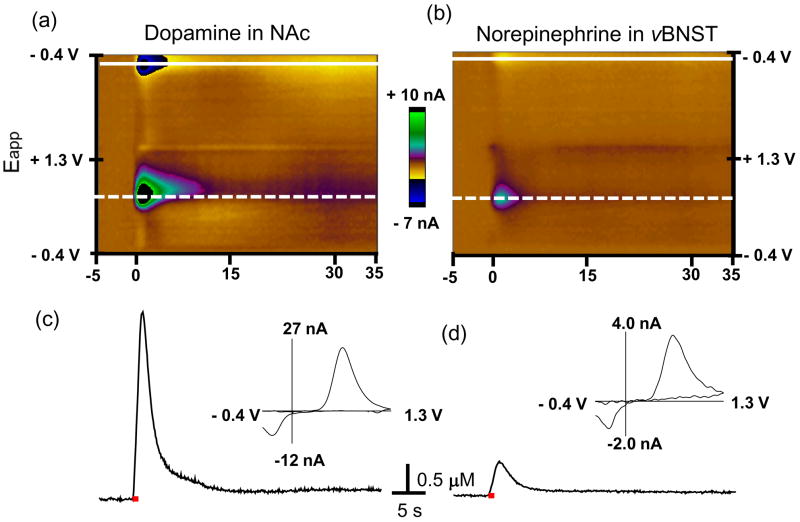
Figure 1. Signal identification of voltammetric data recorded in the NAc and vBNST.
Upper panels: color plots for the voltammetric data, with current changes encoded in false color for dopamine in NAc (a) and norepinephrine in the vBNST (b). The sets composed of all background-subtracted cyclic voltammograms recorded for 40 s before and after electrical stimulation of the VTA/SN and VNB (60 Hz, 60 pulses; delivered at 0 s). Catecholamine concentration changes are apparent in the color plots at the potential for their oxidation (~ 0.65 V, dotted line) and reduction (~−0.23 V, solid line). The traces of dopamine in the NAc (c) and norepinephrine in the vBNST (d) evoked by the electrical stimulation measured. The traces (dotted line) were shown at the potential at which catecholamine is oxidized. Electrical stimulation is indicated with the solid red bars under the traces. Insets: background-subtracted cyclic voltammograms recorded at the maximum of the evoked release.

