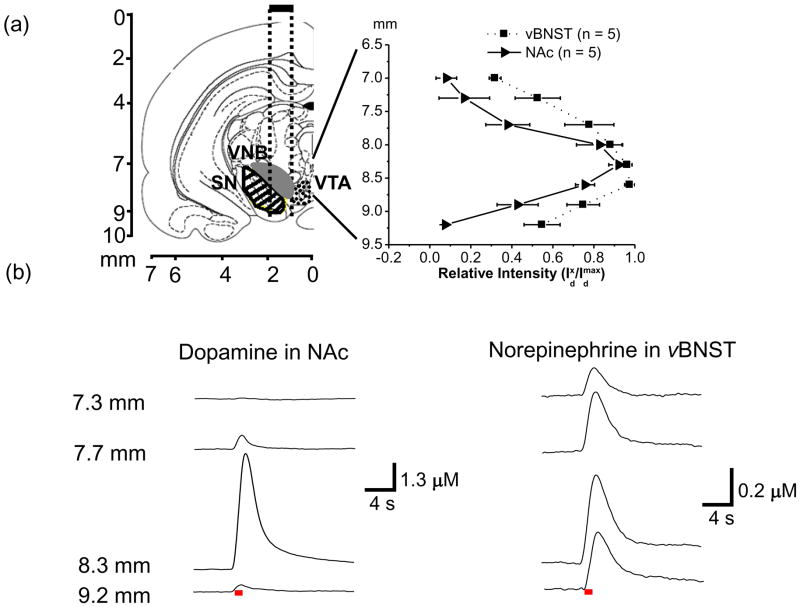
Figure 3. Maps of electrically evoked catecholamine responses measured in the NAc and vBNST as a function of depth of the stimulating electrode.
Coronal section (AP −5.2 mm from bregma) illustrates the approximate path of the stimulating electrode tips (dotted lines) aimed at the VNB (filled region SN (striped) and VTA (dotted)) (a, left). Relative intensity of dopamine in NAc (—with triangles) and norepinephrine in vBNST (··· with squares) evoked at different positions of the stimulating electrode (60 Hz, 60 pulses) (a, right). The coronal sections were taken from the atlas of Paxinos and Watson (2007). Approximate placements of the VTA/SN and VNB in the diagram were based on the previous studies (Ungerstedt 1971, Paxinos & Watson 2007, Park et al. 2009). Representative concentration versus time traces for dopamine (b, left) and norepinephrine (b, right) release at different positions of the stimulating microelectrode in the same animal. Distance (mm) on the left is depth from the skull for stimulating electrode. Electrical stimulation is indicated with the solid red bars under the traces. Abbreviations used: VTA, ventral tegmental area; SN, substantia nigra; VNB, ventral tegmental area.

