Figure 5.
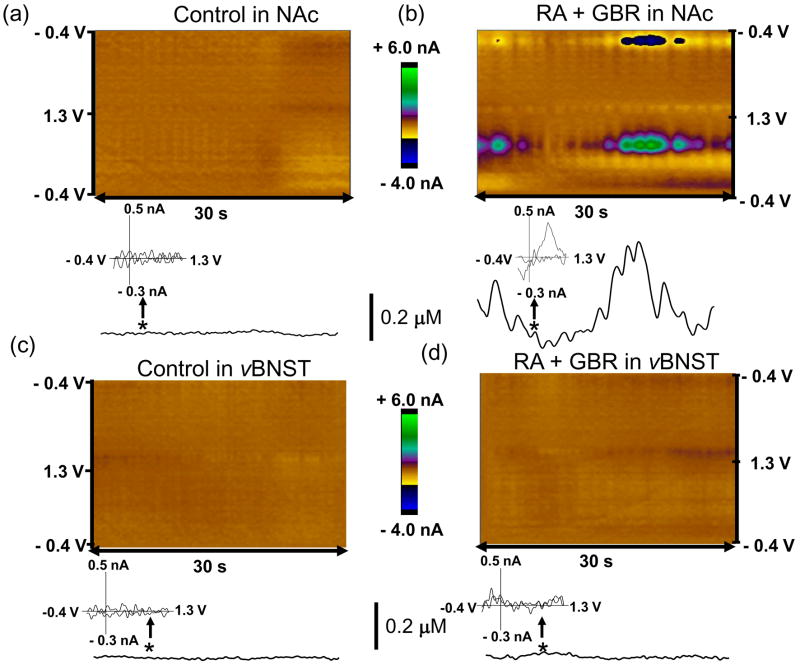
Dopamine drugs induced dopamine concentration transients in the NAc. Two-dimensional color plot representation of the background-subtracted cyclic voltammograms collected over 30 sec (a, c) before and (b, d) following administration of the dopamine drugs (raclopride (2 mg/kg, i.p.) and GBR 12909 (15 mg/kg, i.p.)) in the NAc and the vBNST. Dopamine concentration changes are apparent in the color plot (b) at the potential for its oxidation (~ 0.65 V) and its reduction (−0.2 V). Principal component regression was used to extract the time course of the catecholamine concentration transients (lower traces in a-d). Times are indicated by the vertical bars. Inset: The cyclic voltammogram recorded at the time indicated by the arrow (b) was identical to that for dopamine.

