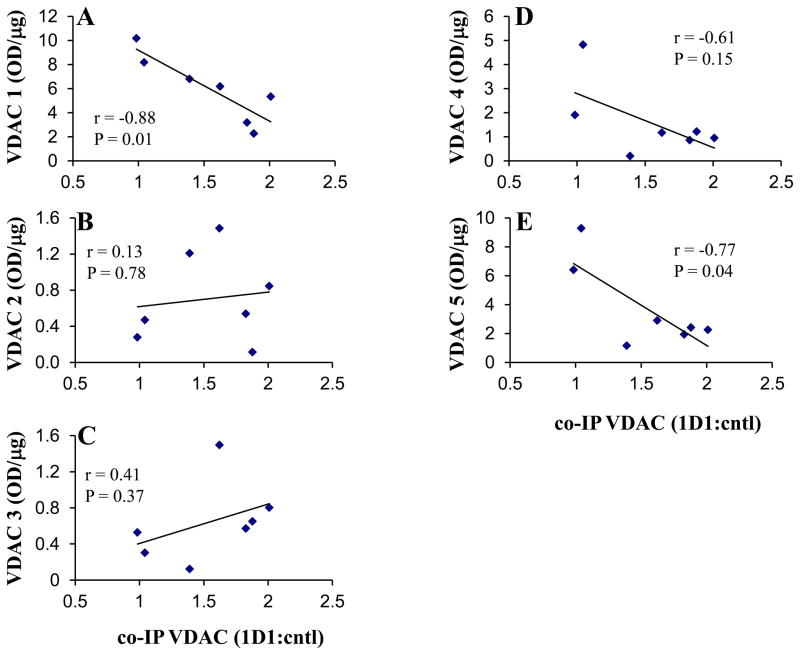
Figure 5. Correlation of VDAC1 oligomer levels in 1D1 depleted extracts to VDAC1 recovered in the immunoprecipitates.
VDAC1 oligomers 1–5 (A–E, respectively) intensities (normalized per μg protein loaded) following Bax 1D1 immunodepletion were plotted against VDAC1 recovered in the immunoprecipitates (expressed relative to control lanes, and normalized to starting cell number). The high and low K data were combined for the analysis. Correlation coefficients (r) and P-values resulting from two-tailed correlation analyses are provided. The coefficients of determination (R2) for oligomers 1–5 from the linear regressions were 0.77, 0.02, 0.16, 0.37, and 0.59, respectively.

