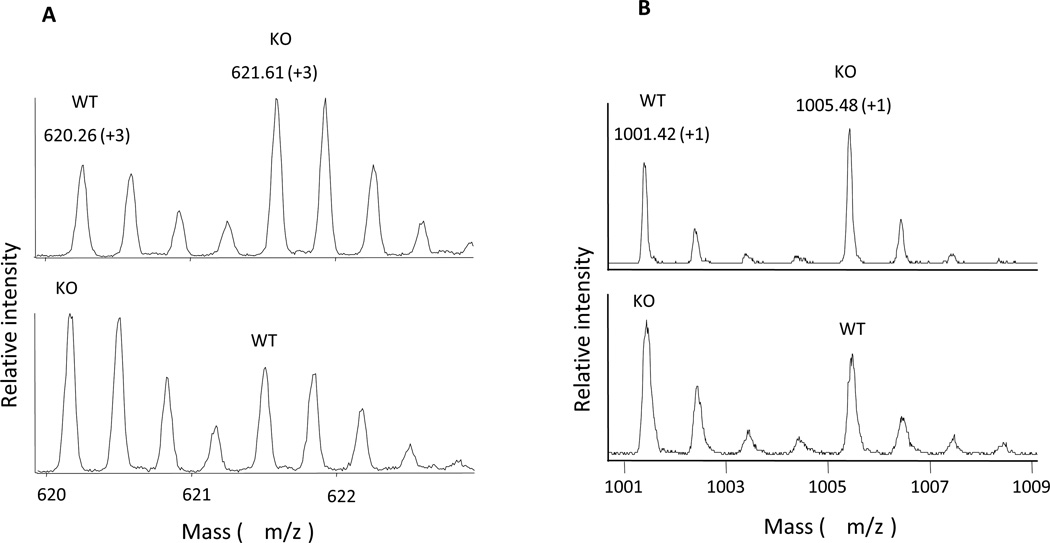
Figure 5. Representative mass spectra of succinic anhydride (SA)-labeled peptides from mice spinal cord obtained by MS analysis.
A. LC-ESI-Q-TOF mass spectra of a labeled peptide pair (MW 1757.78, charge state +3) after the combination of [H4]-SA labeled WT and [D4]-SA labeled KO samples (upper panel), or [D4]-SA labeled WT and [H4]-SA labeled KO samples (lower panel). B. MALDI-TOF mass spectra of a labeled peptide pair (MW 900.42, charge state +1) after the combination of [H4]-SA labeled WT and [D4]-SA labeled KO samples (upper panel), or [D4]-SA labeled WT and [H4]-SA labeled KO samples (lower panel).

