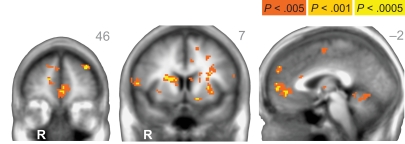
Figure A2.
Brain regions representing the hyperbolic discounted value of the sum of the two options. Best fitting values of k for each subject were used to create a regressor of interest for these neuroimaging analyses. Across subjects, activation in a network of mesolimbic regions (similar to what was observed for the β regressor in the β–δ model) including the medial prefrontal cortex and striatum was correlated with subjective value (see Table A1). R = right. R/L or A/P, value listed in upper right corner of each statistical map. Anatomical underlay is an average of all subjects’ spatially normalized structural scans.

