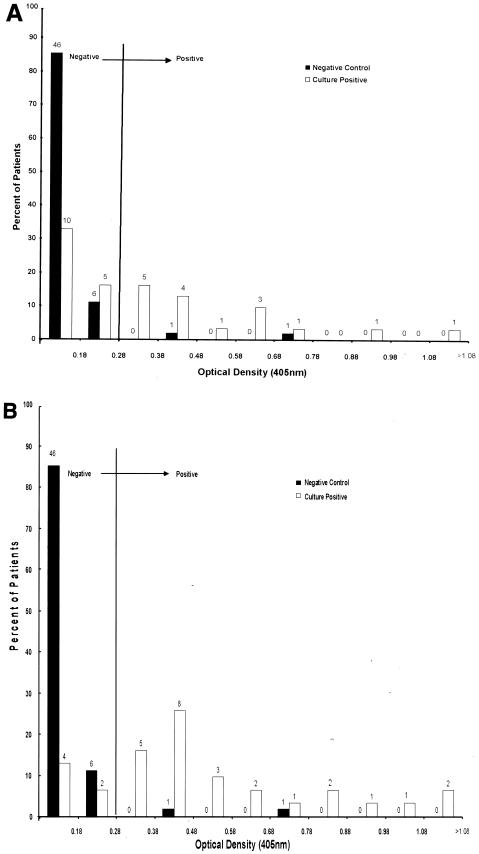
FIG. 1.
(A) Comparative distribution of ELISA values against M. genitalium LAMP antigens among negative control samples (n = 54) and M. genitalium culture-positive serum samples (n = 31) at time of culture. The negative cutoff (OD405 = 0.28) was determined as 3 standard deviations above the negative control mean. The numbers above individual bars represent the number of patients in each group. (B) Same as panel A except that ELISA values for the culture-positive group correspond to the clinic visit at which each woman's peak antibody titer was achieved.

