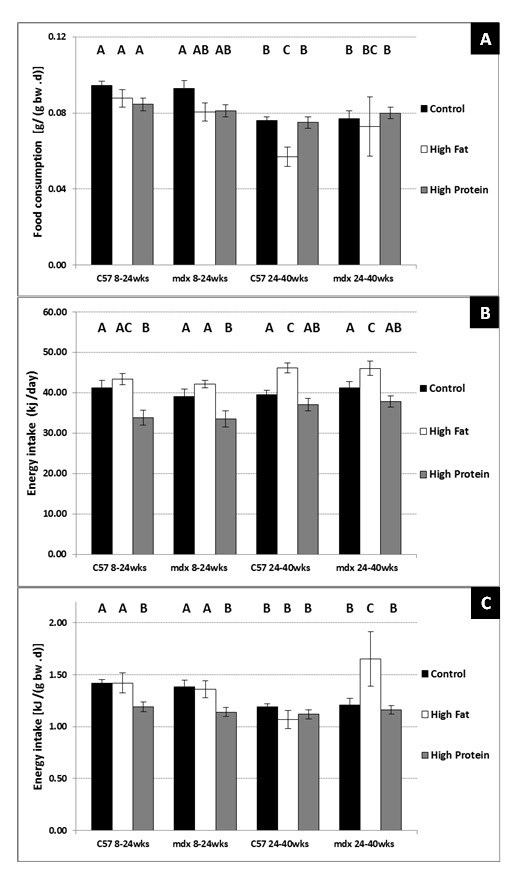
Figure 1. Average daily food consumption [g/ (g bw .d)] (A), absolute energy intake (kJ/ day) (B) and standardised energy intake [kJ/ (g bw .d)] (C), for C57 and mdx mice; a comparison of sedentary mice on a control diet, high fat diet or high protein diet between 8-24 weeks of age and 24-40 weeks of age. Bars represent standard error. N= 8 for all groups. A,B,C denotes significant differences, groups with different letters are significantly different from each other (P<0.05).