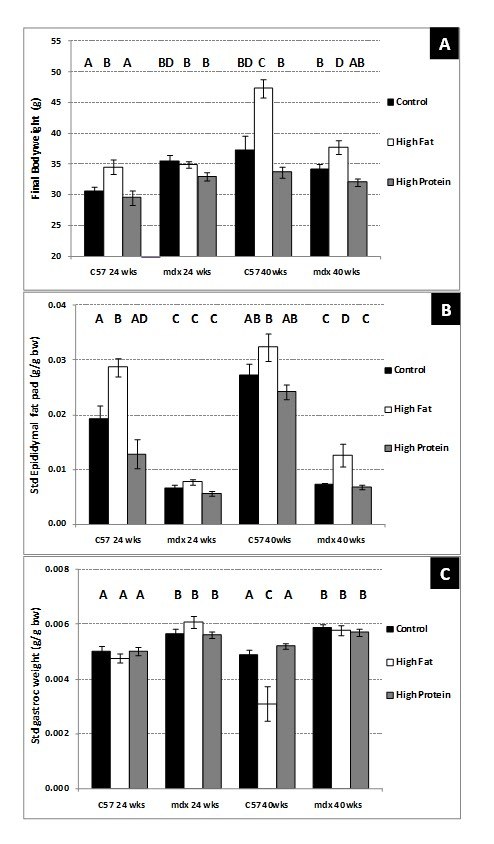
Figure 2. Composition of sedentary 24 and 40-week-old C57 and mdx mice; a comparison of sedentary mice on a control diet, high fat diet or high protein diet. (A) Total body weight. (B) Standardised epidiymal fat pad weight (g fat/g bw). (C) Standardised gastrocnemius muscle weight (g muscle /g bw). Bars represent standard error. N= 8 for all groups. A,B,C,D denotes significant differences, groups with different letters are significantly different from each other (P<0.05).