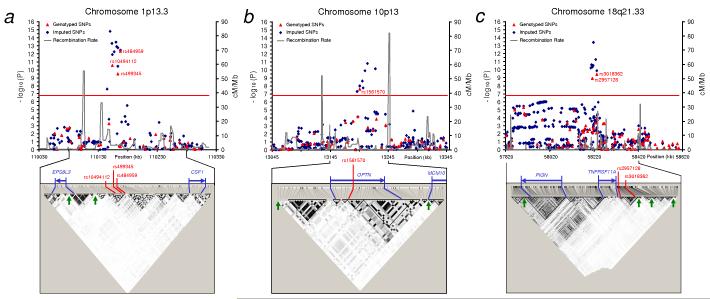
Figure 2. Details of loci associated with Paget’s disease.
Association and linkage disequilibrium (LD) plots of regions showing genome wide significant association with Paget’s disease located on (a) chr 1p13, (b) chr 10p13 and (c) 18q21. The chromosomal position (based on NCBI human genome Build 36) of SNPs is plotted against genomic-control adjusted −log10 P. Genotyped SNPs are shown as red triangles and imputed SNPs as blue diamonds. The estimated recombination rates (cM/Mb) from HapMap CEU release 22 are shown as grey lines and the red horizontal line indicates genome wide significance threshold (P < 1.7 × 10⁻⁷). Genotyped SNPs were tested using stratified Cochran-Mantel-Haenszel test and imputed SNPs were tested using regression analysis based on imputed allelic dosage and adjusting for population clusters. SNPs reaching genome wide significance are shown with red text. LD plots for the indicated regions are based on HapMap CEU release 22 showing LD blocks depicted for alleles with MAF > 0.05 using the r2 colouring scheme of Haploview37. The blue arrows indicate known genes in the region and possible recombination hotspots (> 20 cM/Mb) are shown as green arrows on the LD plots.

